
Profit-Influencing Factors in Orthopedic Surgery: An Analysis of Costs and Reimbursements

 , ,
, ,
Abstract
:1. Introduction
2. Methods
2.1. Study Design
2.2. Participants
2.3. Detailed Study Protocol
2.4. Statistical Analysis
3. Results
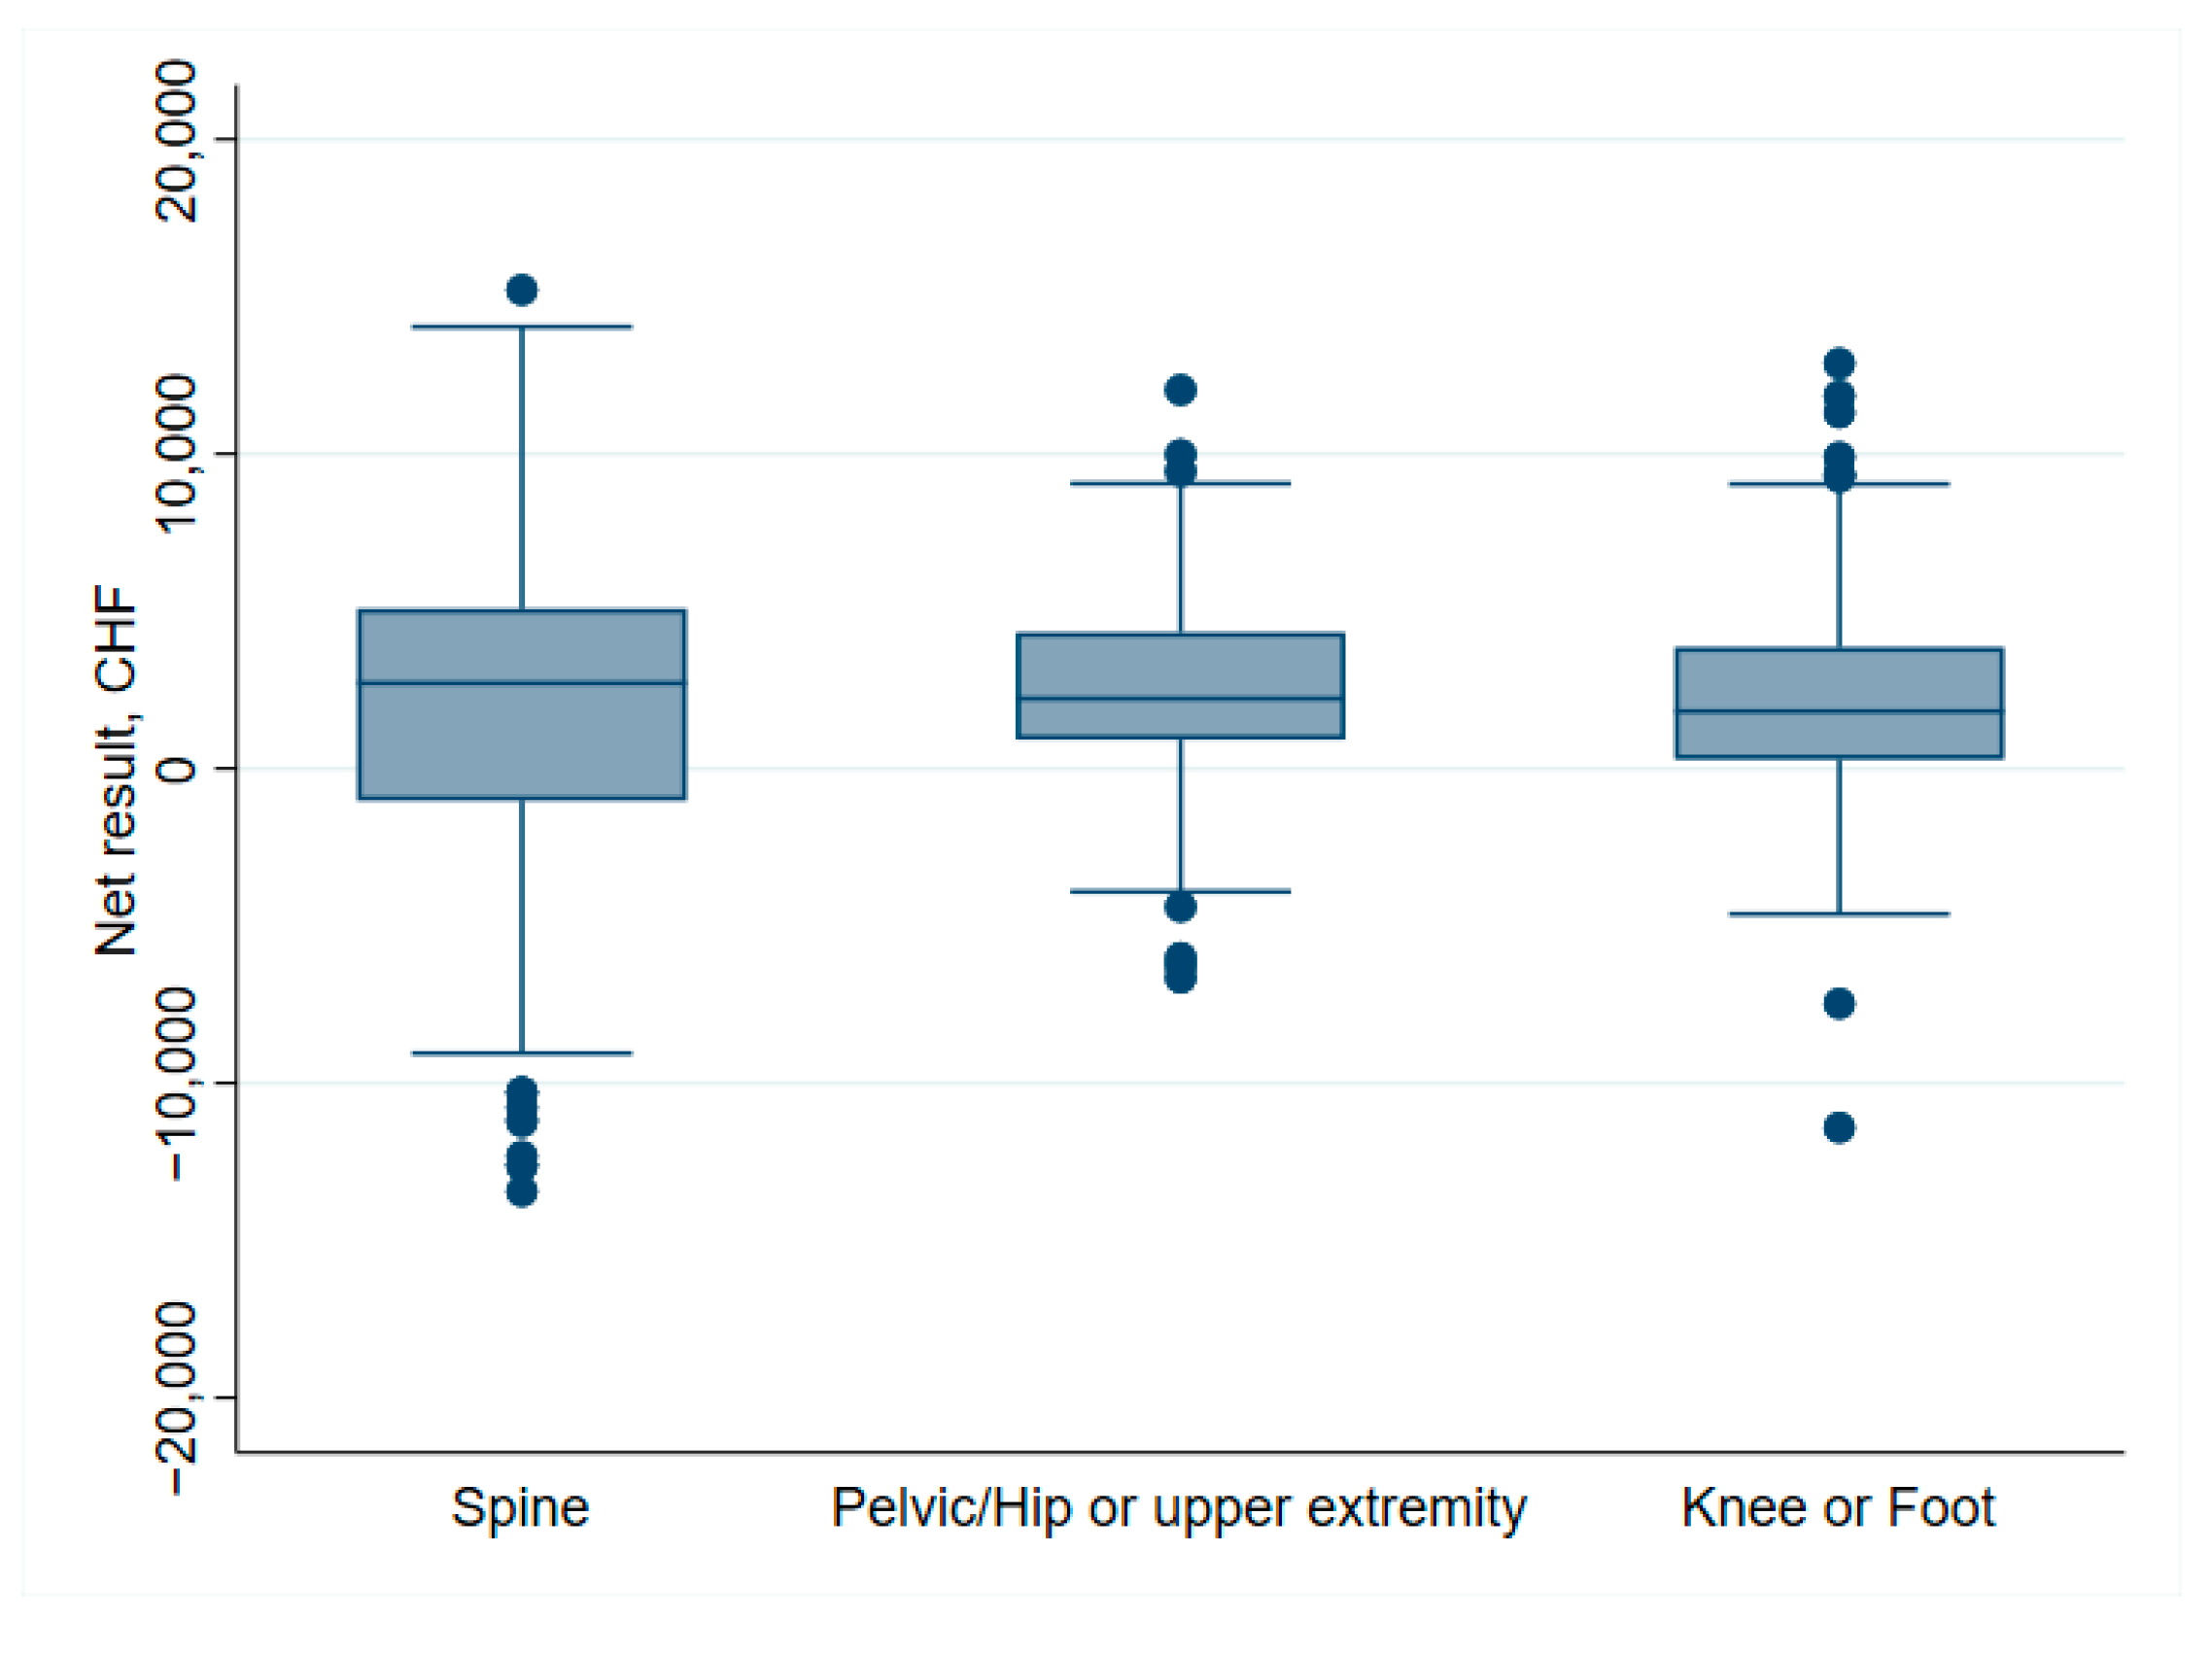
3.1. Primary Aim
3.2. Secondary Aim
4. Discussion
4.1. Primary Aim
4.2. Secondary Aim
4.3. Limitations
5. Conclusions
Author Contributions
Funding
Institutional Review Board Statement
Informed Consent Statement
Data Availability Statement
Acknowledgments
Conflicts of Interest
References
- Bundesamt für Statistik BFS. Szenarien zur Bevölkerungsentwicklung der Schweiz 2010–2060; Bundesamt für Statistik BFS: Neuchatel, Switzerland, 2010; p. 84. [Google Scholar]
- Kurtz, S.; Ong, K.; Lau, E.; Mowat, F.; Halpern, M. Projections of primary and revision hip and knee arthroplasty in the United States from 2005 to 2030. J. Bone Jt. Surg. Am. Vol. 2007, 89, 780–785. [Google Scholar] [CrossRef]
- Braithwaite, R.S.; Col, N.F.; Wong, J.B. Estimating Hip Fracture Morbidity. Mortal. Costs 2003, 51, 364–370. [Google Scholar] [CrossRef]
- Pugely, A.J.; Martin, C.T.; Gao, Y.; Belatti, D.A.; Callaghan, J.J. Comorbidities in Patients Undergoing Total Knee Arthroplasty: Do They Influence Hospital Costs and Length of Stay? Clin. Orthop. Relat. Res. 2014, 472, 3943–3950. [Google Scholar] [CrossRef] [PubMed] [Green Version]
- Fang, C.J.; Shaker, J.M.; Ward, D.M.; Jawa, A.; Mattingly, D.A.; Smith, E.L. Financial Burden of Revision Hip and Knee Arthroplasty at an Orthopedic Specialty Hospital: Higher Costs and Unequal Reimbursements. J. Arthroplast. 2021, 36, 2680–2684. [Google Scholar] [CrossRef] [PubMed]
- Pepper, A.M.; Novikov, D.; Cizmic, Z.; Barrett, J.T.; Collins, M.; Iorio, R.; Schwarzkopf, R.; Long, W.J. Age and Frailty Influence Hip and Knee Arthroplasty Reimbursement in a Bundled Payment Care Improvement Initiative. J. Arthroplast. 2019, 34, S80–S83. [Google Scholar] [CrossRef] [PubMed]
- Rohrer, F.; Nötzli, H.; Risch, L.; Bodmer, T.; Cottagnoud, P.; Hermann, T.; Limacher, A.; Fankhauser, N.; Wagner, K.; Brügger, J. Does Preoperative Decolonization Reduce Surgical Site Infections in Elective Orthopaedic Surgery? A Prospective Randomized Controlled Trial. Clin. Orthop. Relat. Res. 2020, 478, 1790–1800. [Google Scholar] [CrossRef] [PubMed]
- Chin, N.; Perera, P.; Roberts, A.; Nagappan, R. Review of medical discharge summaries and medical documentation in a metropolitan hospital: Impact on diagnostic-related groups and Weighted Inlier Equivalent Separation. Intern Med. J. 2013, 43, 767–771. [Google Scholar] [CrossRef]
- Zafirah, S.A.; Nur, A.M.; Puteh, S.E.W.; Aljunid, S.M. Potential loss of revenue due to errors in clinical coding during the implementation of the Malaysia diagnosis related group (MY-DRG((R))) Casemix system in a teaching hospital in Malaysia. BMC Health Serv. Res. 2018, 18, 38. [Google Scholar] [CrossRef] [PubMed] [Green Version]
- Hines, K.; Mouchtouris, N.; Getz, C.; Gonzalez, G.; Montenegro, T.; Leibold, A.; Harrop, J. Bundled Payment Models in Spine Surgery. Glob. Spine J. 2021, 11 (Suppl. S1), 7S–13S. [Google Scholar] [CrossRef]
- Metz, C.M.; Freiberg, A.A. An international comparative study of total hip arthroplasty cost and practice patterns. J. Arthroplast. 1998, 13, 296–298. [Google Scholar] [CrossRef]
- Busato, A.; von Below, G. The implementation of DRG-based hospital reimbursement in Switzerland: A population-based perspective. Health Res. Policy Syst. 2010, 8, 31. [Google Scholar] [CrossRef] [PubMed] [Green Version]
- Stargardt, T. Health service costs in Europe: Cost and reimbursement of primary hip replacement in nine countries. Health Econ. 2008, 17 (Suppl. S1), S9–S20. [Google Scholar] [CrossRef] [PubMed] [Green Version]
- Chen, H.F.; Bazzoli, G.J.; Hsieh, H.M. Hospital Financial Conditions and the Provision of Unprofitable Services. Atl. Econ. J. 2009, 37, 259–277. [Google Scholar] [CrossRef] [PubMed] [Green Version]


| n | Total (n = 1230) | No Deficit (n = 990) | Cost Deficit (n = 240) | p | |
|---|---|---|---|---|---|
| Female sex | 1230 | 649 (53%) | 498 (50%) | 151 (63%) | <0.001 |
| Active smoker | 1230 | 208 (17%) | 165 (17%) | 43 (18%) | 0.63 |
| Regular alcohol intake | 1230 | 380 (31%) | 313 (32%) | 67 (28%) | 0.28 |
| Alcohol amount (>2 units/day) | 380 * | 33 (2.7%) | 27 (2.7%) | 6 (2.5%) | 1.00 |
| BMI (kg/m2) | 1230 | 26 [24,30] | 26 [24,30] | 27 [24,30] | 0.91 |
| Renal insufficiency | 1230 | 11 (0.89%) | 8 (0.81%) | 3 (1.3%) | 0.46 |
| Diabetes | 1230 | 81 (6.6%) | 56 (5.7%) | 25 (10%) | 0.013 |
| Healthy | 1230 | 1027 (83%) | 840 (85%) | 187 (78%) | 0.012 |
| Type of procedure | 1230 | <0.001 | |||
| Spine surgery | 236 (19%) | 162 (16%) | 74 (31%) | ||
| Pelvic/Hip or upper extremity | 516 (42%) | 449 (45%) | 67 (28%) | ||
| Knee or Foot | 478 (39%) | 379 (38%) | 99 (41%) | ||
| Spine surgery | 236 ** | 0.015 | |||
| Decompression | 41 (3.3%) | 34 (3.4%) | 7 (2.9%) | ||
| Stabilisation | 93 (7.6%) | 55 (5.6%) | 38 (16%) | ||
| Decompression & Stabilisation | 91 (7.4%) | 63 (6.4%) | 28 (12%) | ||
| Other | 11 (0.89%) | 10 (1.0%) | 1 (0.42%) | ||
| Hip or shoulder surgery | 516 ** | <0.001 | |||
| Hip: Primary | 390 (32%) | 368 (37%) | 22 (9.2%) | ||
| Hip: Revision | 28 (2.3%) | 22 (2.2%) | 6 (2.5%) | ||
| Hip: Other | 3 (0.24%) | 3 (0.30%) | 0 (0.00%) | ||
| Shoulder: Primary | 66 (5.4%) | 36 (3.6%) | 30 (13%) | ||
| Shoulder: Revision | 11 (0.89%) | 6 (0.61%) | 5 (2.1%) | ||
| Shoulder: Other | 11 (0.89%) | 10 (1.0%) | 1 (0.42%) | ||
| Upper Extremity: Other | 7 (0.57%) | 4 (0.40%) | 3 (1.3%) | ||
| Knee or Foot surgery | 478 ** | <0.001 | |||
| Knee: Primary | 291 (24%) | 268 (27%) | 23 (10%) | ||
| Knee: Revision | 50 (4.1%) | 37 (3.7%) | 13 (5.4%) | ||
| Knee: Other | 11 (0.89%) | 9 (0.91%) | 2 (0.83%) | ||
| Foot: Primary | 104 (8.5%) | 50 (5.1%) | 54 (22%) | ||
| Foot: Revision | 12 (0.98%) | 7 (0.71%) | 5 (2.1%) | ||
| Foot: Other | 10 (0.81%) | 8 (0.81%) | 2 (0.83%) | ||
| Total (n = 1230) | No Deficit (n = 990) | Cost Deficit (n = 240) | p | |
|---|---|---|---|---|
| Age | 0.61 * | |||
| <50 years | 274 (22%) | 220 (22%) | 54 (22%) | |
| 50–59 years | 287 (23%) | 237 (24%) | 50 (21%) | |
| 60–69 years | 383 (31%) | 311 (31%) | 72 (30%) | |
| 70–79 years | 254 (21%) | 196 (20%) | 58 (24%) | |
| >80 years | 32 (2.6%) | 26 (2.6%) | 6 (2.5%) | |
| Myocardial infarction | 49 (4.0%) | 37 (3.7%) | 12 (5.0%) | 0.36 |
| Congestive heart failure | 39 (3.2%) | 28 (2.8%) | 11 (4.6%) | 0.21 |
| Peripheral vascular disease | 22 (1.8%) | 14 (1.4%) | 8 (3.3%) | 0.06 |
| CVI or TIA | 47 (3.8%) | 36 (3.6%) | 11 (4.6%) | 0.46 |
| Dementia | 0 | 0 | 0 | |
| COPD | 20 (1.6%) | 16 (1.6%) | 4 (1.7%) | 1.00 |
| Connective tissue disease | 57 (4.6%) | 44 (4.4%) | 13 (5.4%) | 0.50 |
| Peptic ulcer disease | 7 (0.57%) | 3 (0.30%) | 4 (1.7%) | 0.030 |
| Liver disease | 0.58 * | |||
| none | 1226 (100%) | 987 (100%) | 239 (100%) | |
| mild | 3 (0.24%) | 2 (0.20%) | 1 (0.42%) | |
| moderate to severe | 1 (0.08%) | 1 (0.10%) | 0 (0.00%) | |
| Diabetes mellitus | 0.07 * | |||
| none or diet-controlled | 1151 (94%) | 934 (94%) | 217 (90%) | |
| uncomplicated | 67 (5.4%) | 47 (4.7%) | 20 (8.3%) | |
| end-organ disease | 12 (0.98%) | 9 (0.91%) | 3 (1.3%) | |
| Hemiplegia | 3 (0.24%) | 1 (0.10%) | 2 (0.83%) | 0.10 |
| Moderate to severe CKD | 4 (0.33%) | 2 (0.20%) | 2 (0.83%) | 0.17 |
| Solid tumour | 0.80 * | |||
| none | 1162 (94%) | 937 (95%) | 225 (94%) | |
| localized | 63 (5.1%) | 49 (4.9%) | 14 (5.8%) | |
| metastatic | 5 (0.41%) | 4 (0.40%) | 1 (0.42%) | |
| Leukaemia | 8 (0.65%) | 7 (0.71%) | 1 (0.42%) | 1.00 |
| Lymphoma | 0 | 0 | 0 | |
| AIDS | 0 | 0 | 0 | |
| AACCI score | 2.0 [1.0–3.0] | 2.0 [1.0–3.0] | 2.0 [1.0–3.0] | 0.16 |
| Variable | Difference in Net Financial Result (in CHF) | p | |
|---|---|---|---|
| Univariable | |||
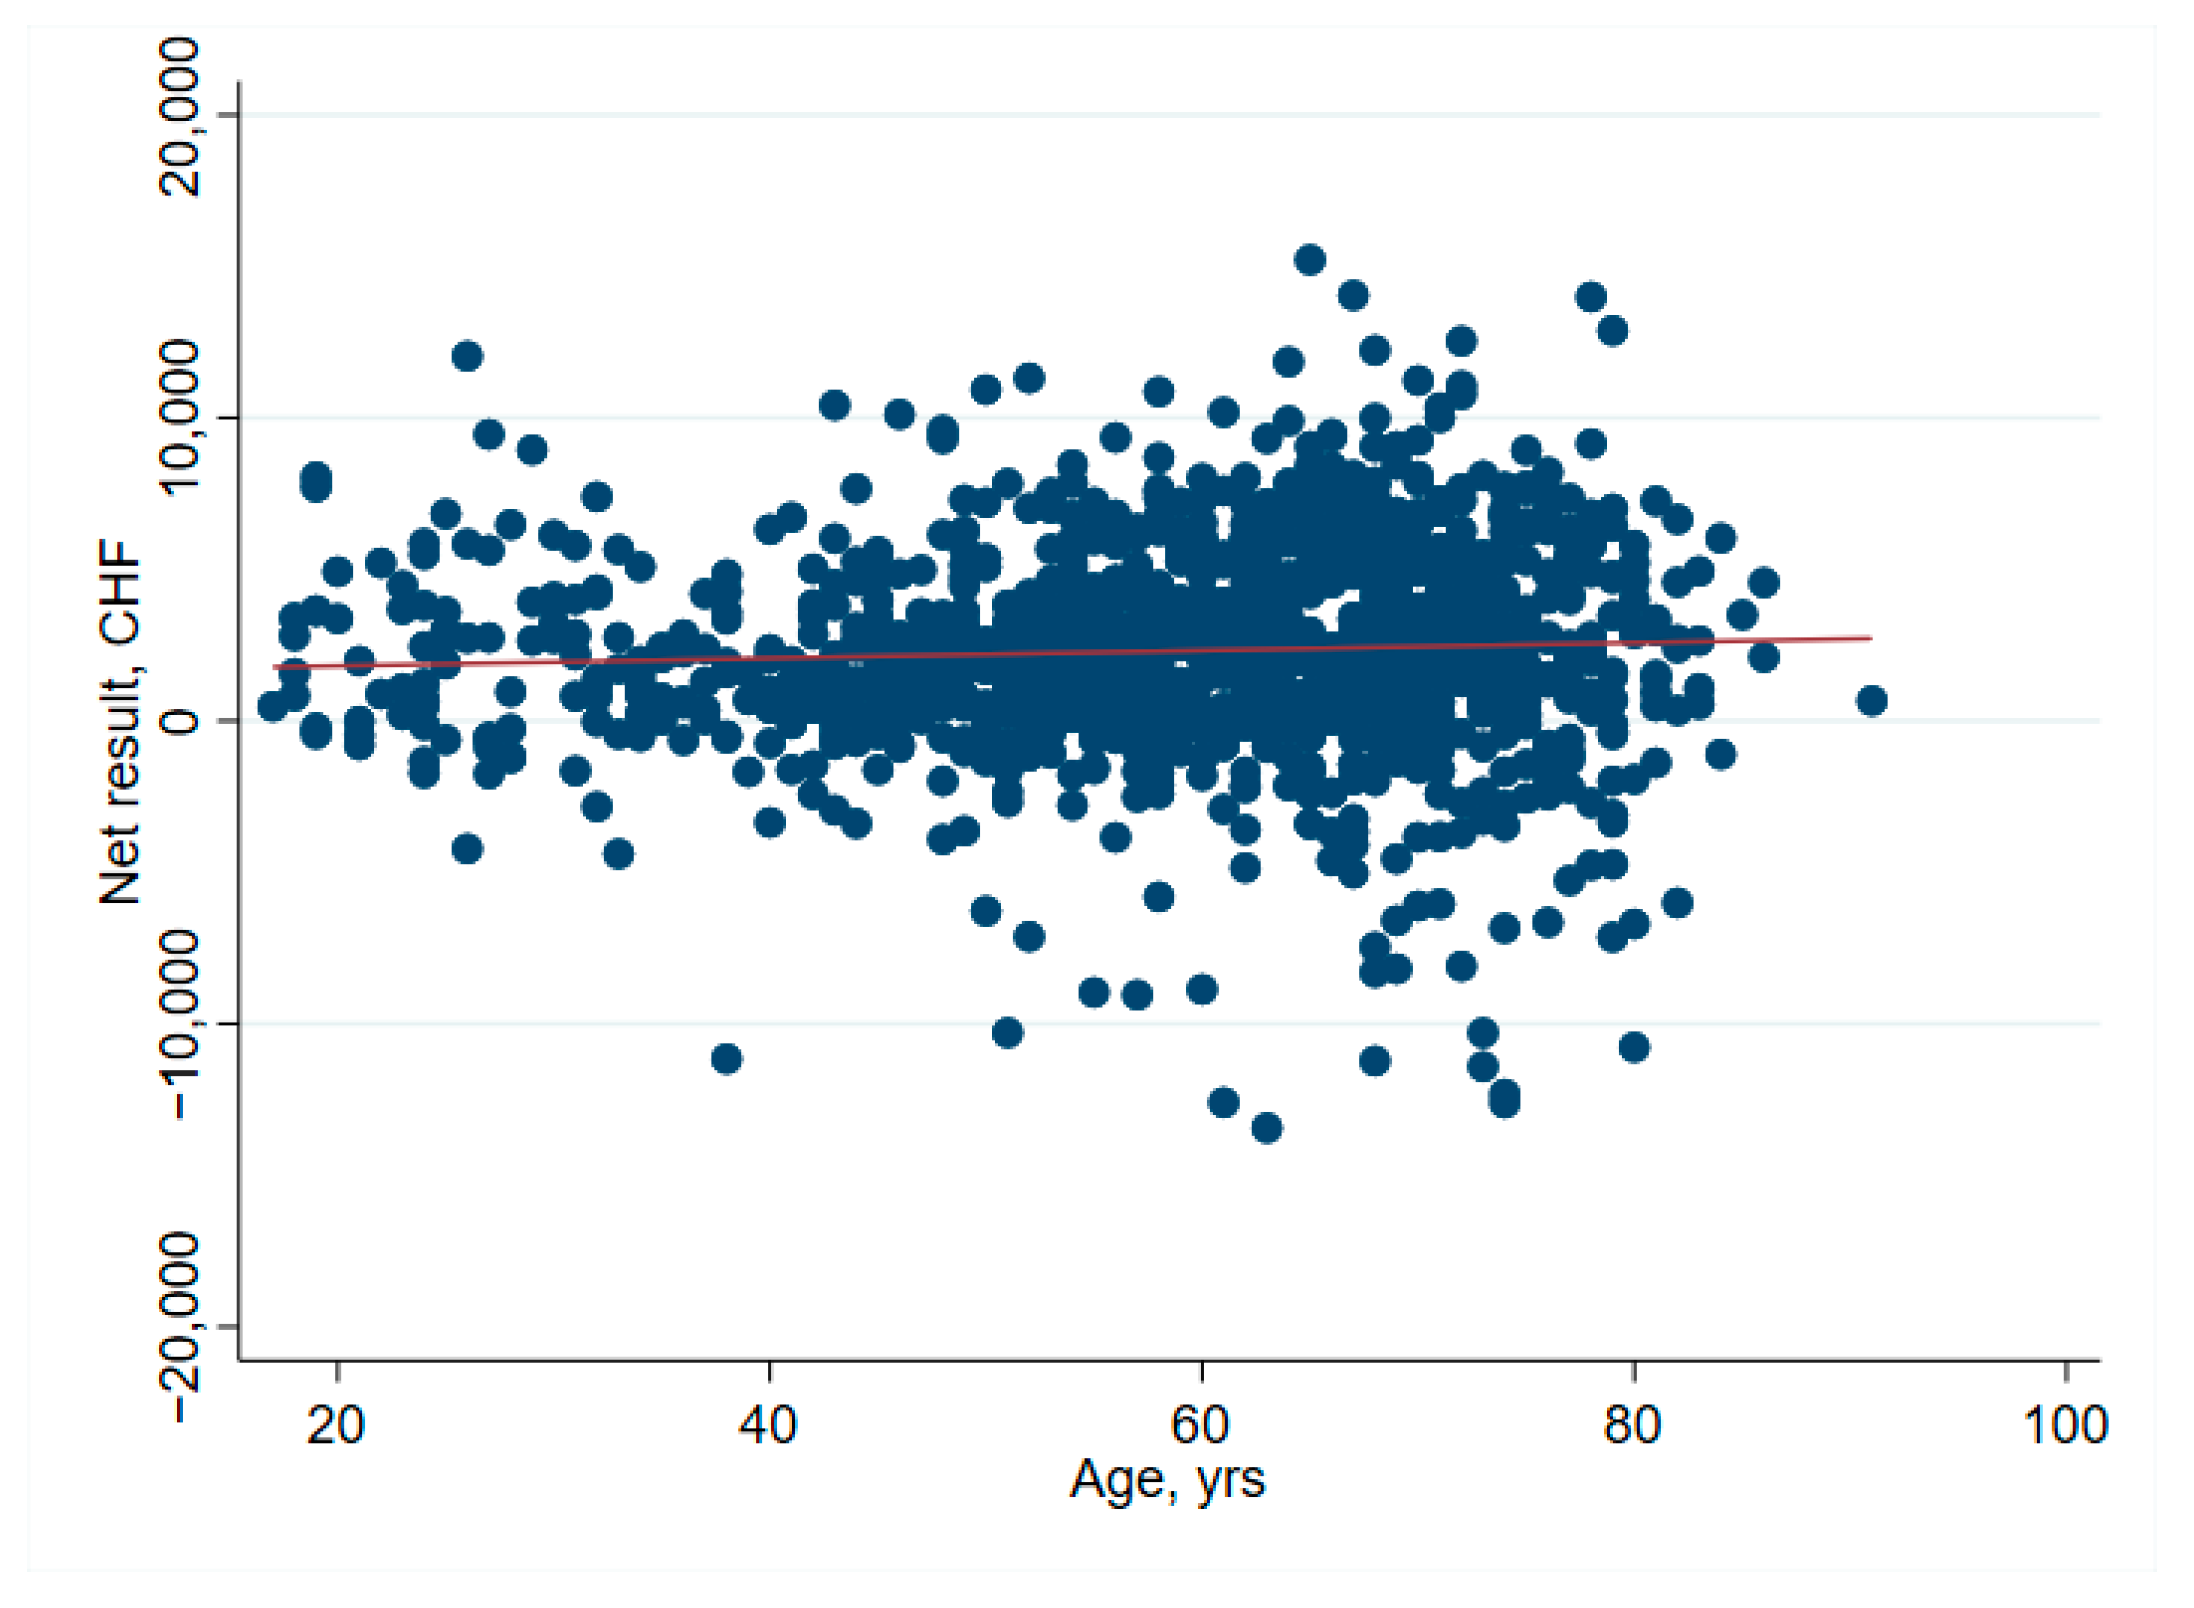
| Entire cohort, n = 1229 | Age per year | 13 (−1–26) | 0.068 |
| Entire cohort, n = 1229 | Healthy | 341 (−176–859) | 0.196 |
| Entire cohort, n =1 229 | Cost weight | 1026 (758–1293) | <0.001 |
| Spine surgery, n = 235 | Cost weight | −56 (−879–766) | 0.893 |
| Primary hip surgery, n = 390 | Cost weight | 1017 (−226–2259) | 0.108 |
| Primary shoulder surgery, n = 66 | Cost weight | 2030 (934–3127) | <0.001 |
| Primary knee surgery, n = 291 | Cost weight | 1992 (1475–2508) | <0.001 |
| Primary foot surgery, n = 104 | Cost weight | −1044 (−3549–1462) | 0.411 |
| Multivariable | |||
| Entire cohort, n = 1229 | Age per year | −4 (−19–11) | 0.614 |
| Healthy | 544 (24–1064) | 0.040 | |
| Cost weight | 1082 (796–1369) | <0.001 | |
| Spine surgery, n = 235 | Age per year | −28 (−90–34) | 0.372 |
| Healthy | −640 (−2403–1123) | 0.475 | |
| Cost weight | 11 (−843–864) | 0.980 | |
| Primary hip surgery, n = 390 | Age per year | −22 (−40–−4) | 0.018 |
| Healthy | 923 (304–1542) | 0.004 | |
| Cost weight | 2256 (784–3728) | 0.003 | |
| Primary shoulder surgery, n = 66 | Age per year | −11 (−56–34) | 0.629 |
| Healthy | −353 (−1786–1081) | 0.624 | |
| Cost weight | 2157 (893–3421) | 0.001 | |
| Primary knee surgery, n = 291 | Age per year | 20 (−9–48) | 0.171 |
| Healthy | 727 (−60–1513) | 0.070 | |
| Cost weight | 1848 (1256–2439) | <0.001 | |
| Primary foot surgery, n = 104 | Age per year | −14 (−38–10) | 0.241 |
| Healthy | 461 (−698–1620) | 0.432 | |
| Cost weight | −408 (−3058–2243) | 0.761 | |
| Cost Unit | Total (n = 1230) Median [Q1–Q3] | No Deficit (n = 990) Median [Q1–Q3] | Cost Deficit (n = 240) Median [Q1–Q3] | p |
|---|---|---|---|---|
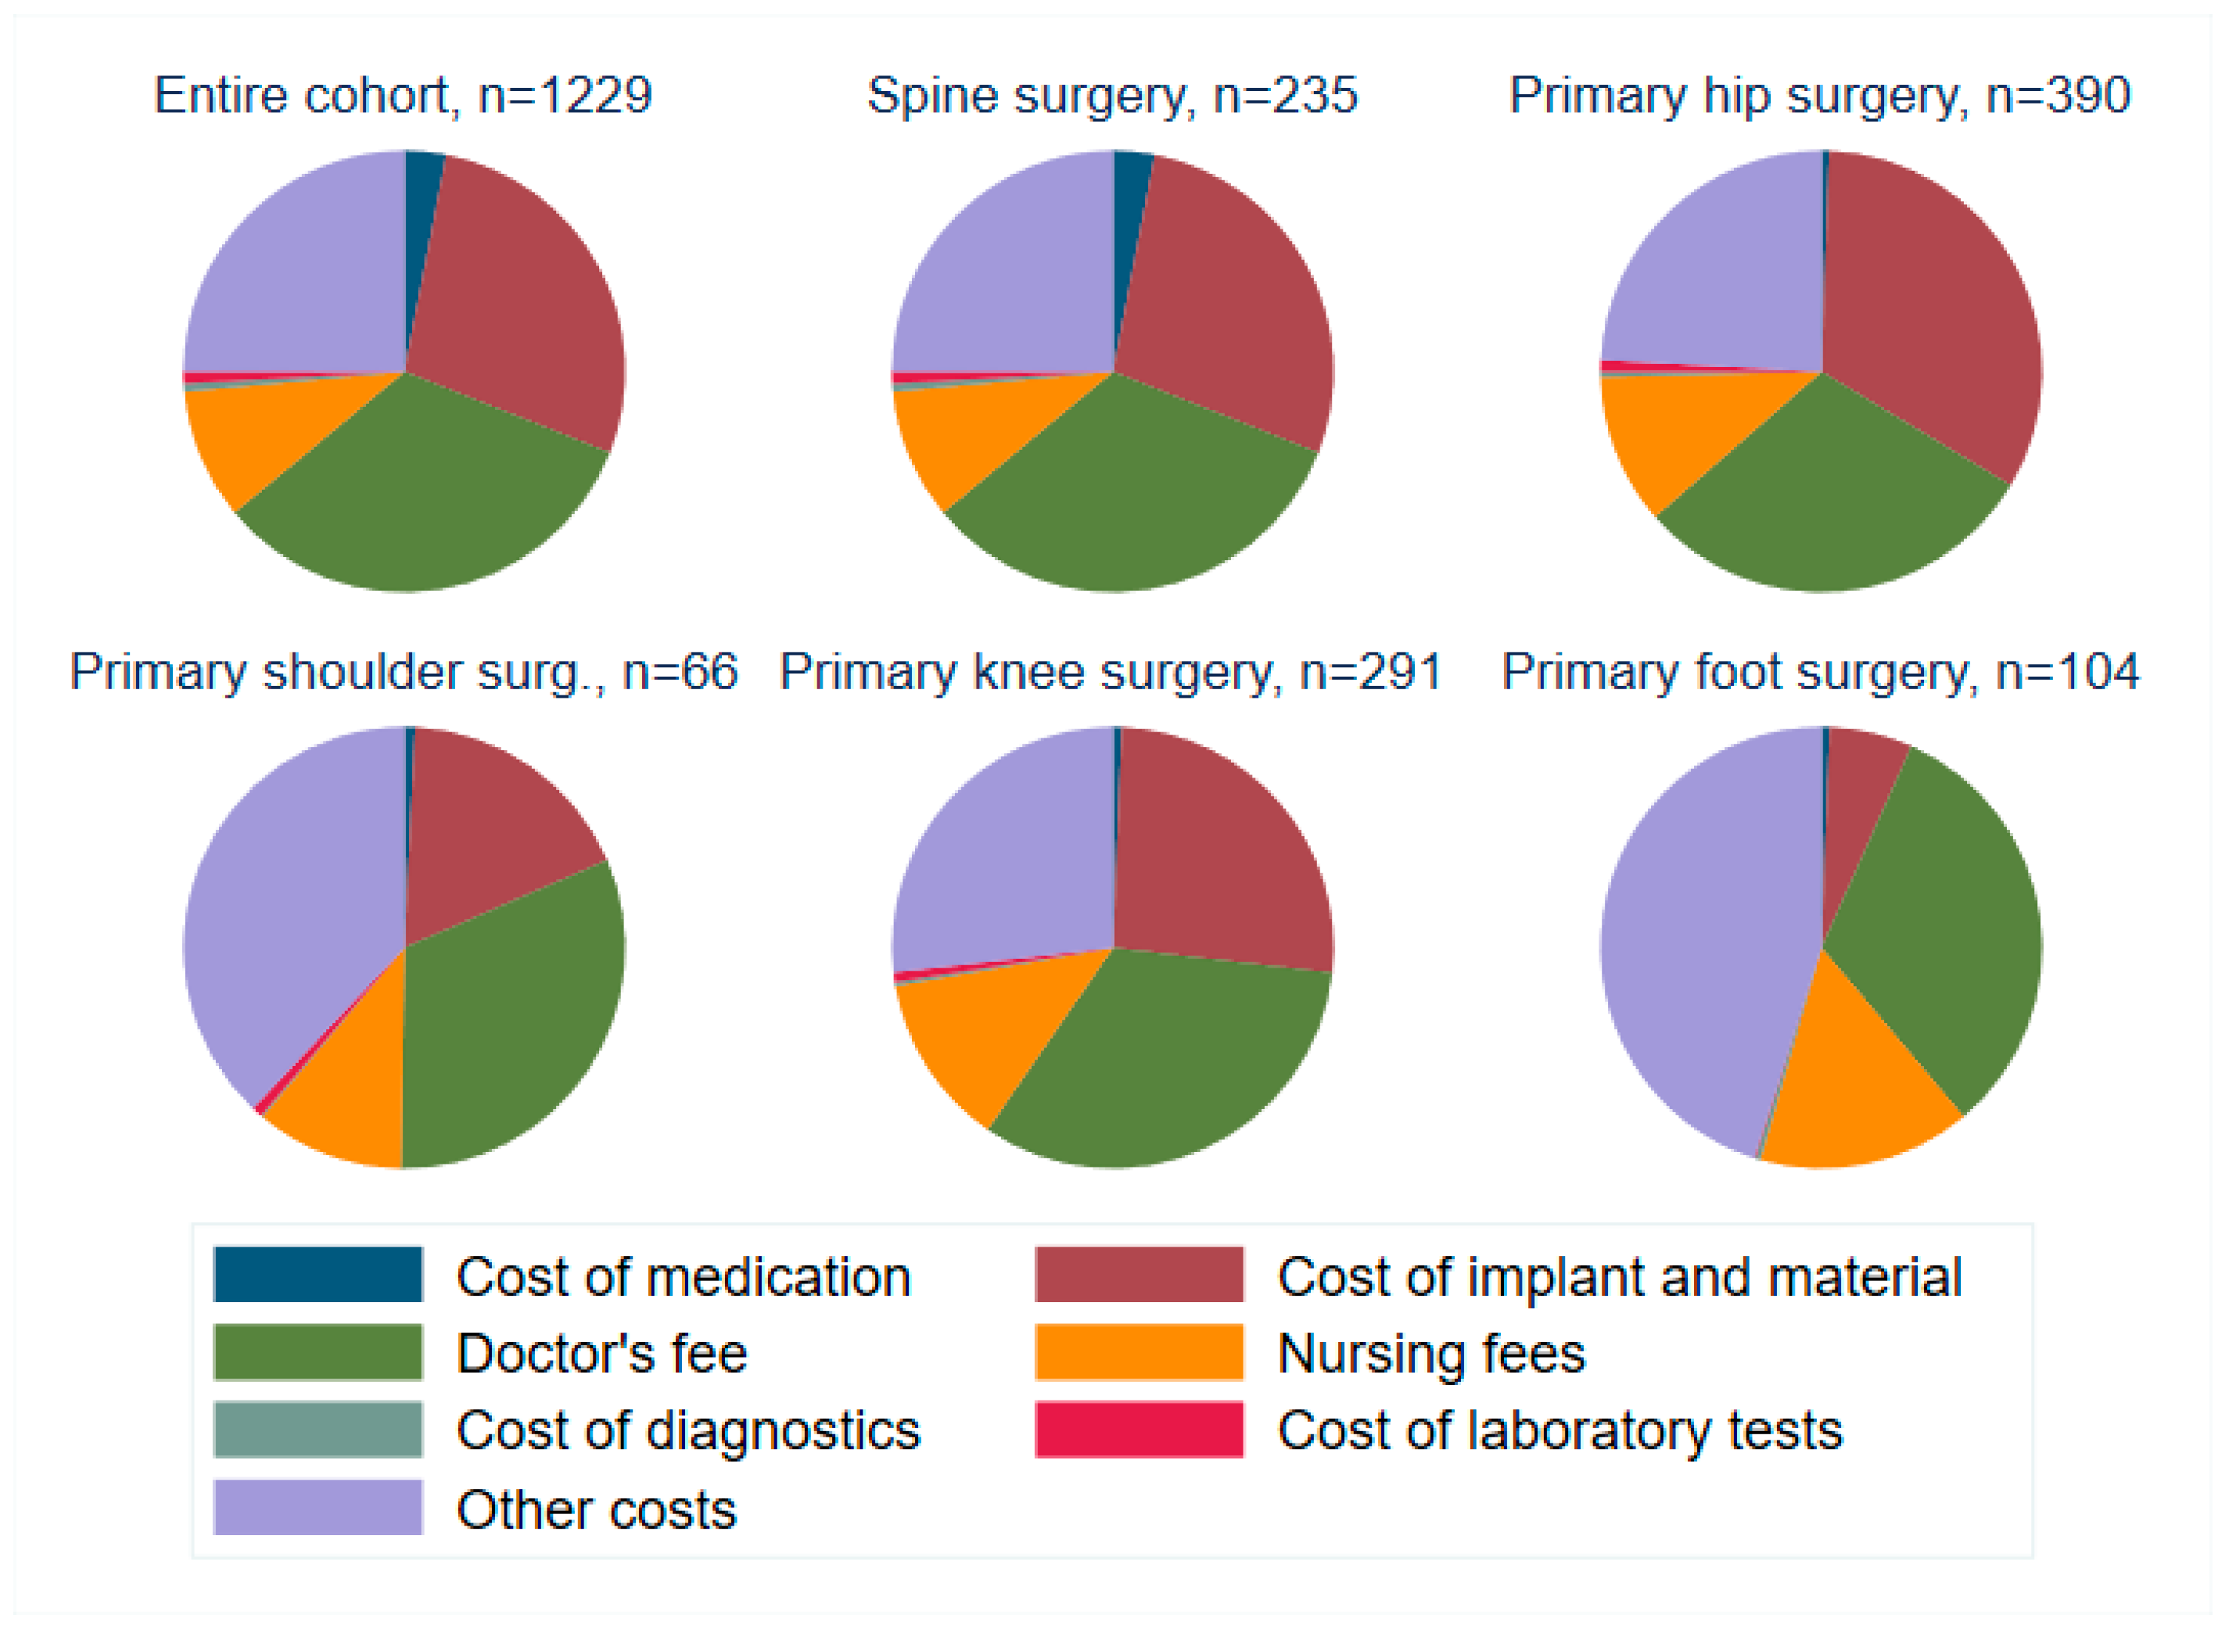
| Cost of medication | 69 [52–99] | 68 [52–93] | 81 [52–149] | <0.001 |
| Cost of implant and material | 5096 [812–5730] | 5334 [98–5718] | 2039 [553–7778] | 0.49 |
| Doctor’s fee | 3689 [2990–6704] | 3873 [3170–6860] | 3309 [1510–4696] | <0.001 |
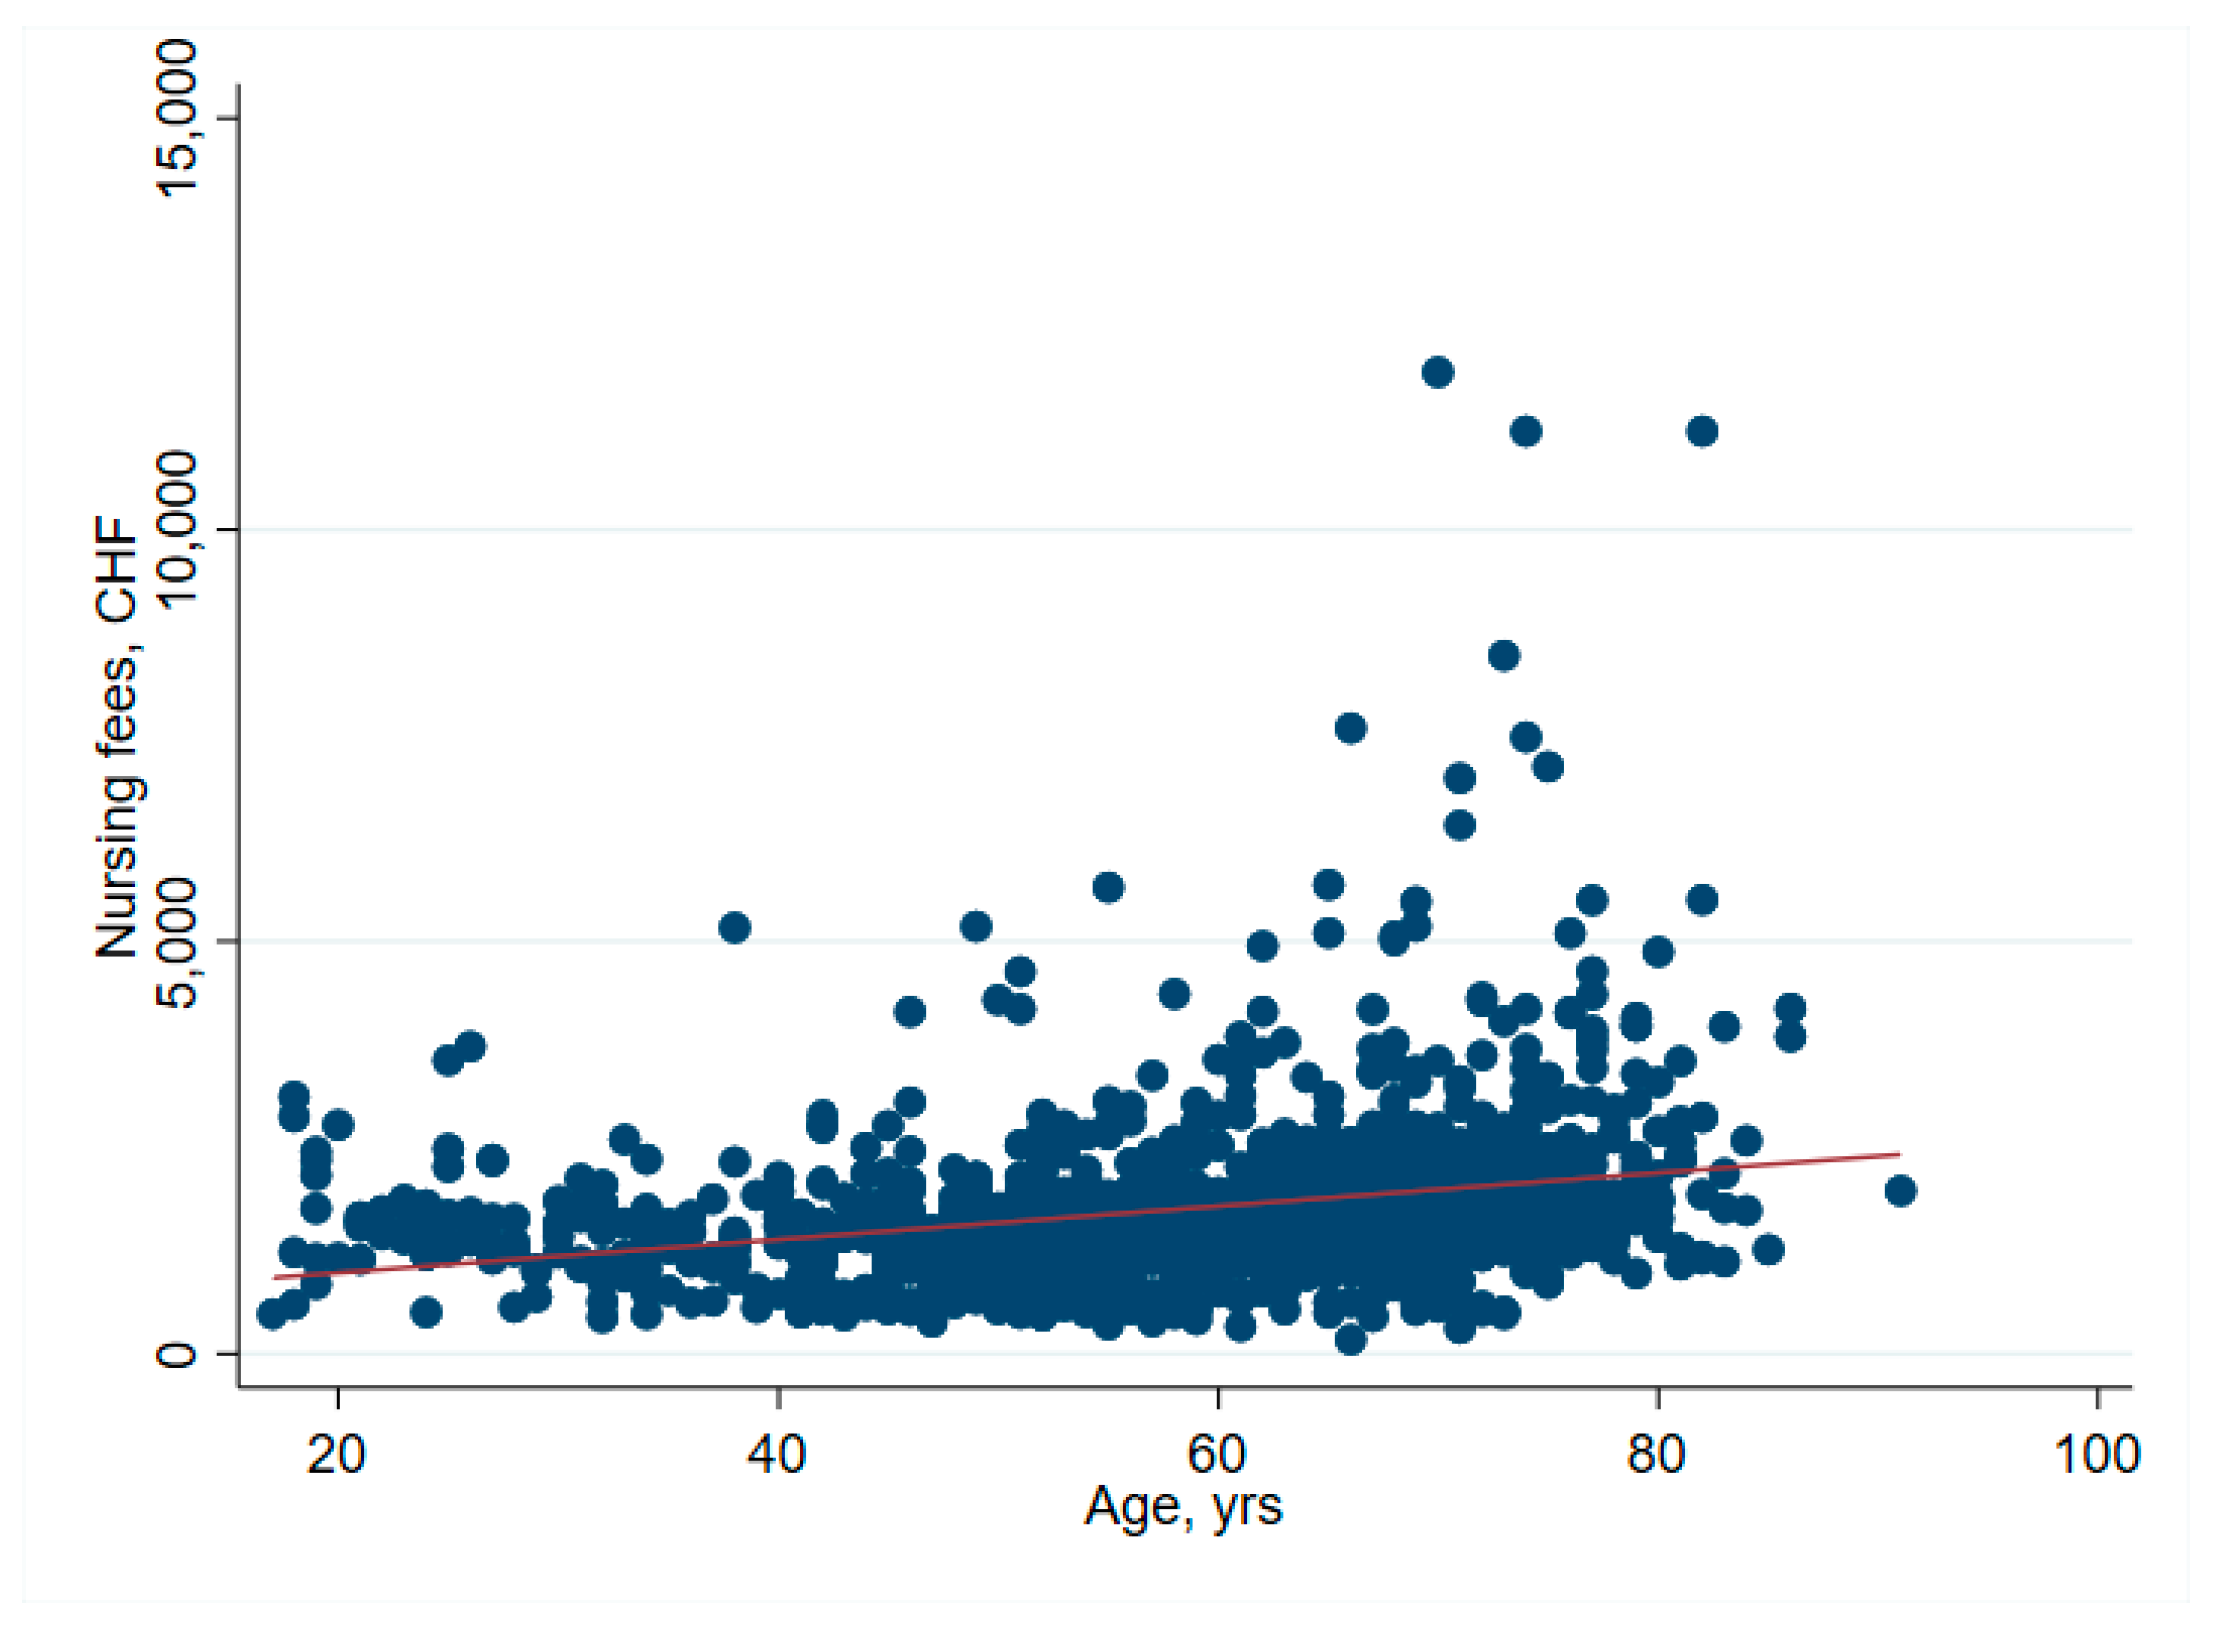
| Nursing costs | 1587 [1213–2058] | 1552 [1202–1952] | 1766 [1288–2740] | <0.001 |
| Cost of diagnostics | 33 [21–80] | 33 [25–80] | 45 [17–80] | 0.85 |
| Cost of laboratory tests | 107 [78–147] | 107 [82–141] | 107 [0.00–197] | 0.93 |
| Periintervenional costs | 3805 [3151–4873] | 3617 [3031–4447] | 5146 [3967–7193] | <0.001 |
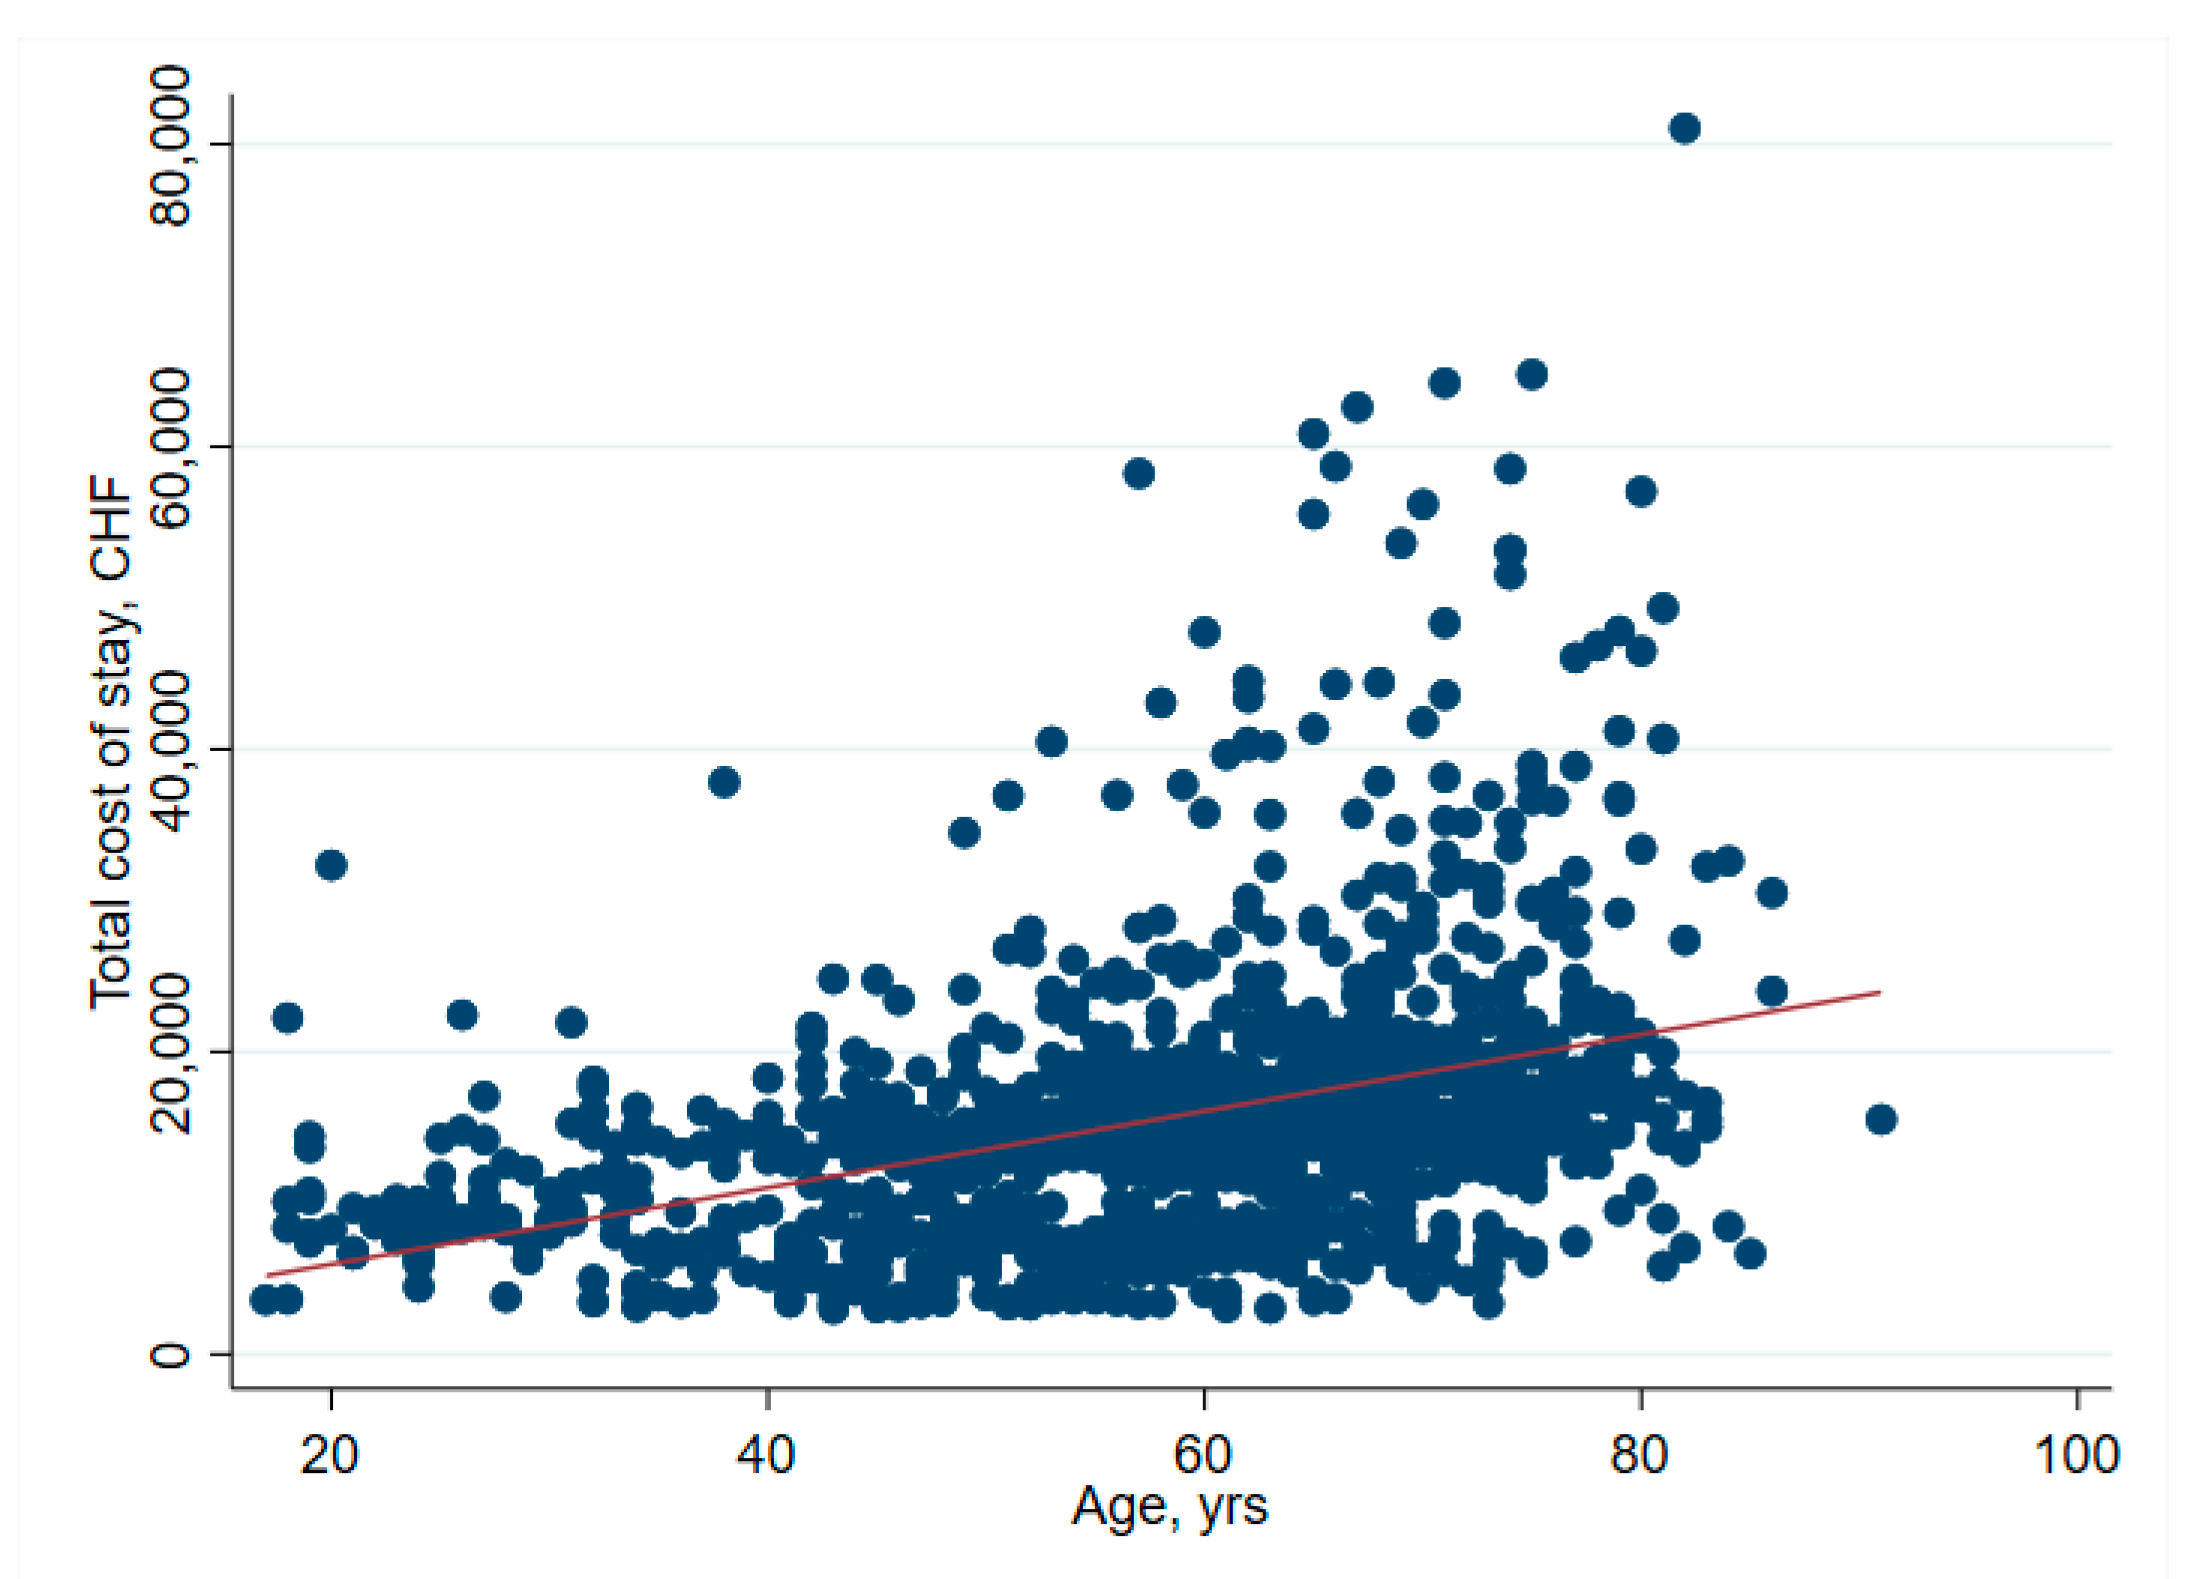
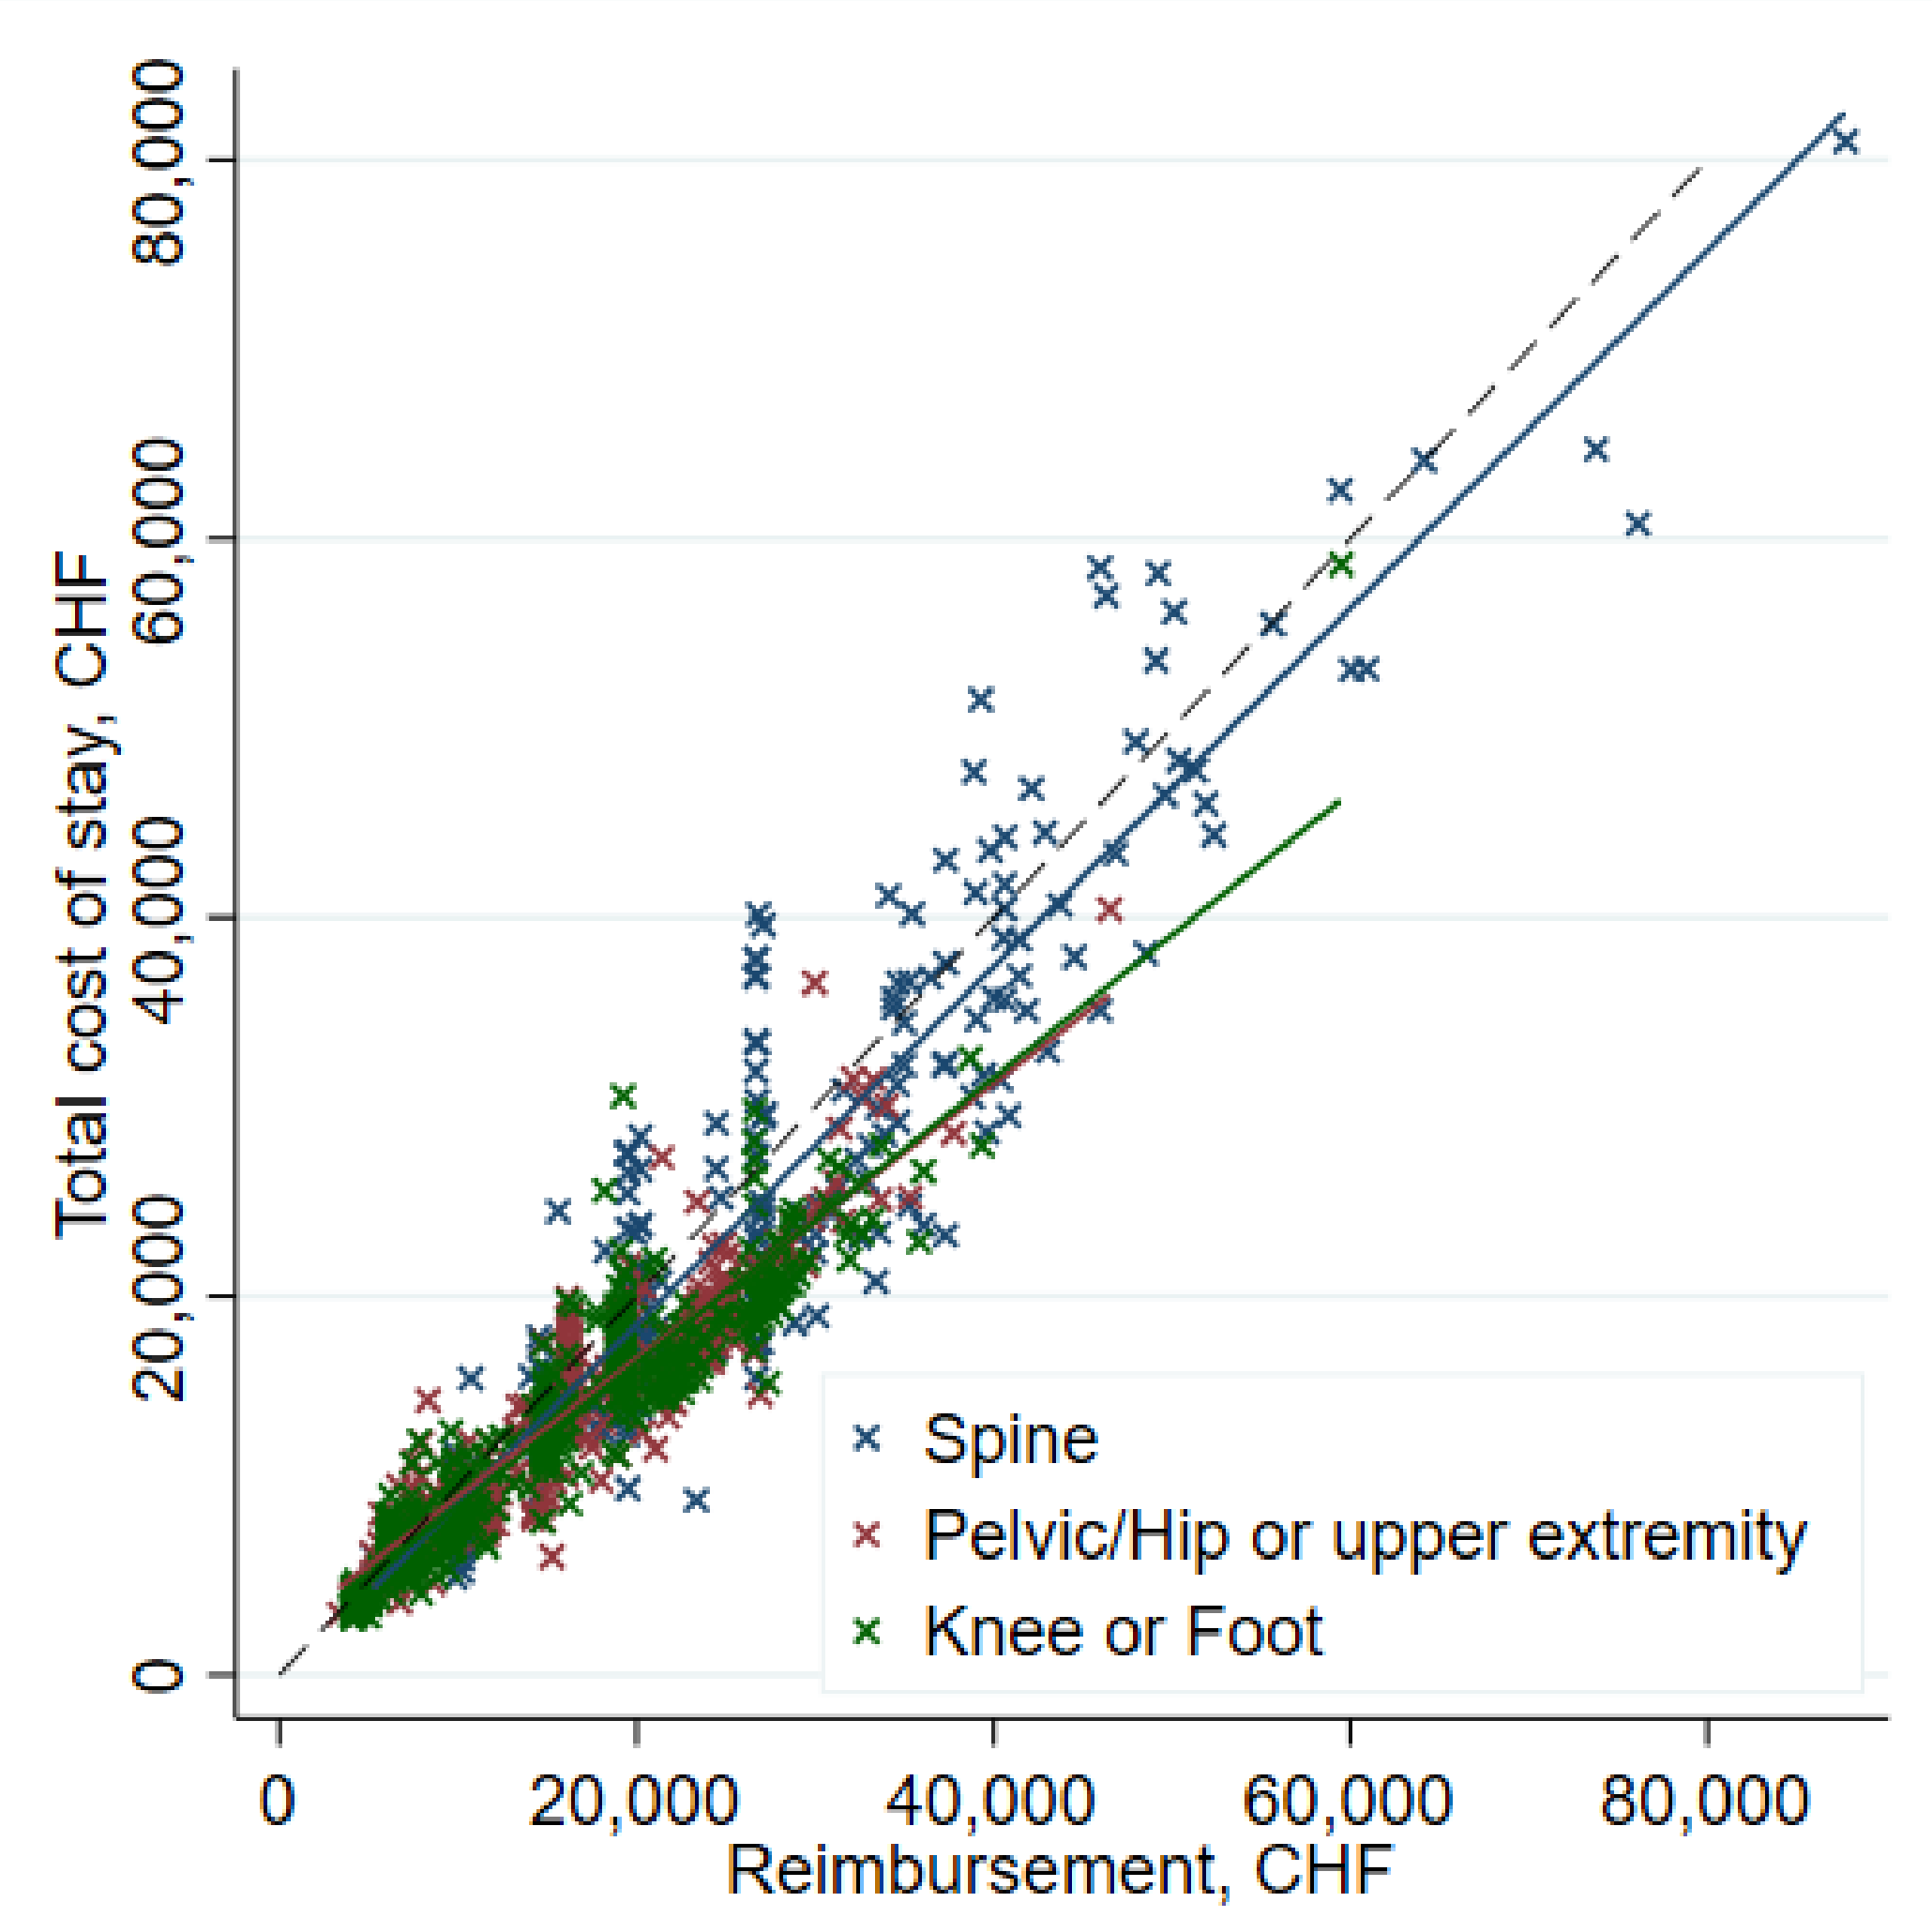
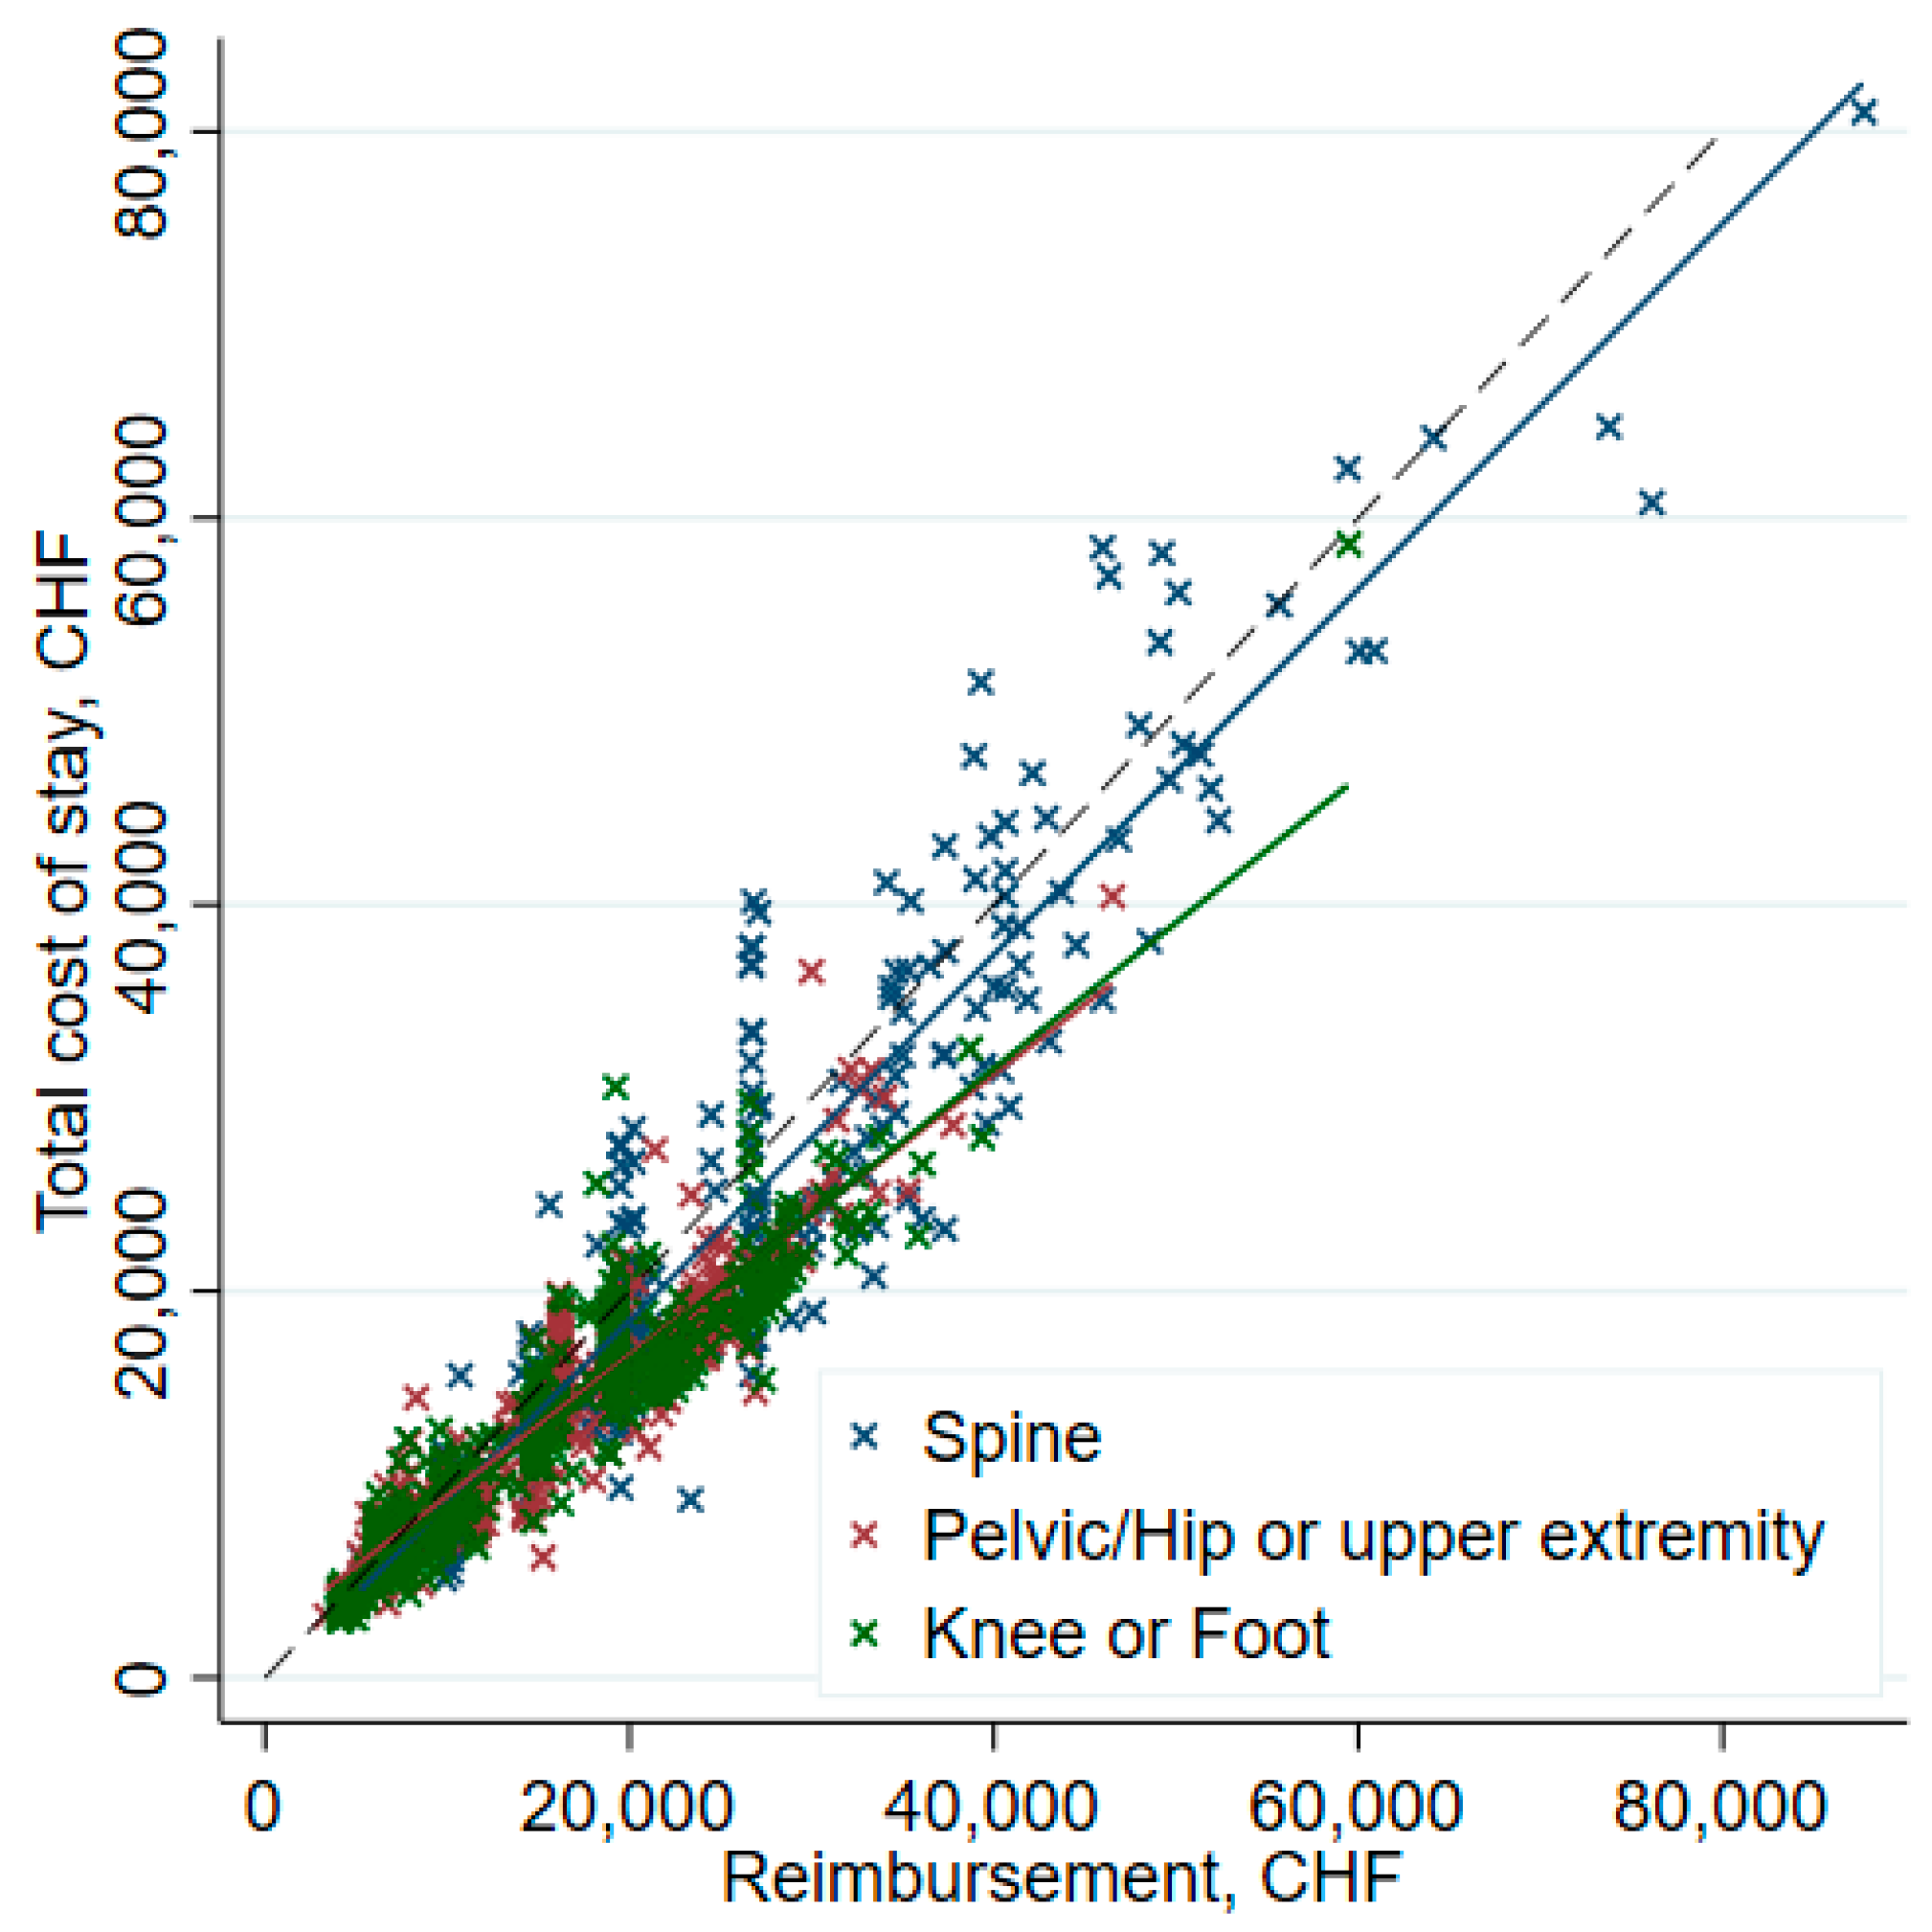
| Total cost of stay | 14,676 [9684–18,501] | 14,676 [10,943–18,022] | 14,921 [8139–23,656] | 0.23 |
| Total reimbursement | 16,160 [11,375–22,942] | 16,186 [14,521–23,188] | 13,842 [6703–20,039] | <0.001 |
| Net result | 2147 [422–4435] | 2741 [1504–5062] | −1240 [−2811–−492] | n/a |
| Total (n = 1230) Median [Q1–Q3] | No Deficit (n = 990) Median [Q1–Q3] | Cost Deficit (n = 240) Median [Q1–Q3] | p | |
|---|---|---|---|---|
| Cost weight | 1.7 [0.99–2.0] | 1.7 [1.2–2.0] | 1.0 [0.63–2.0] | <0.001 |
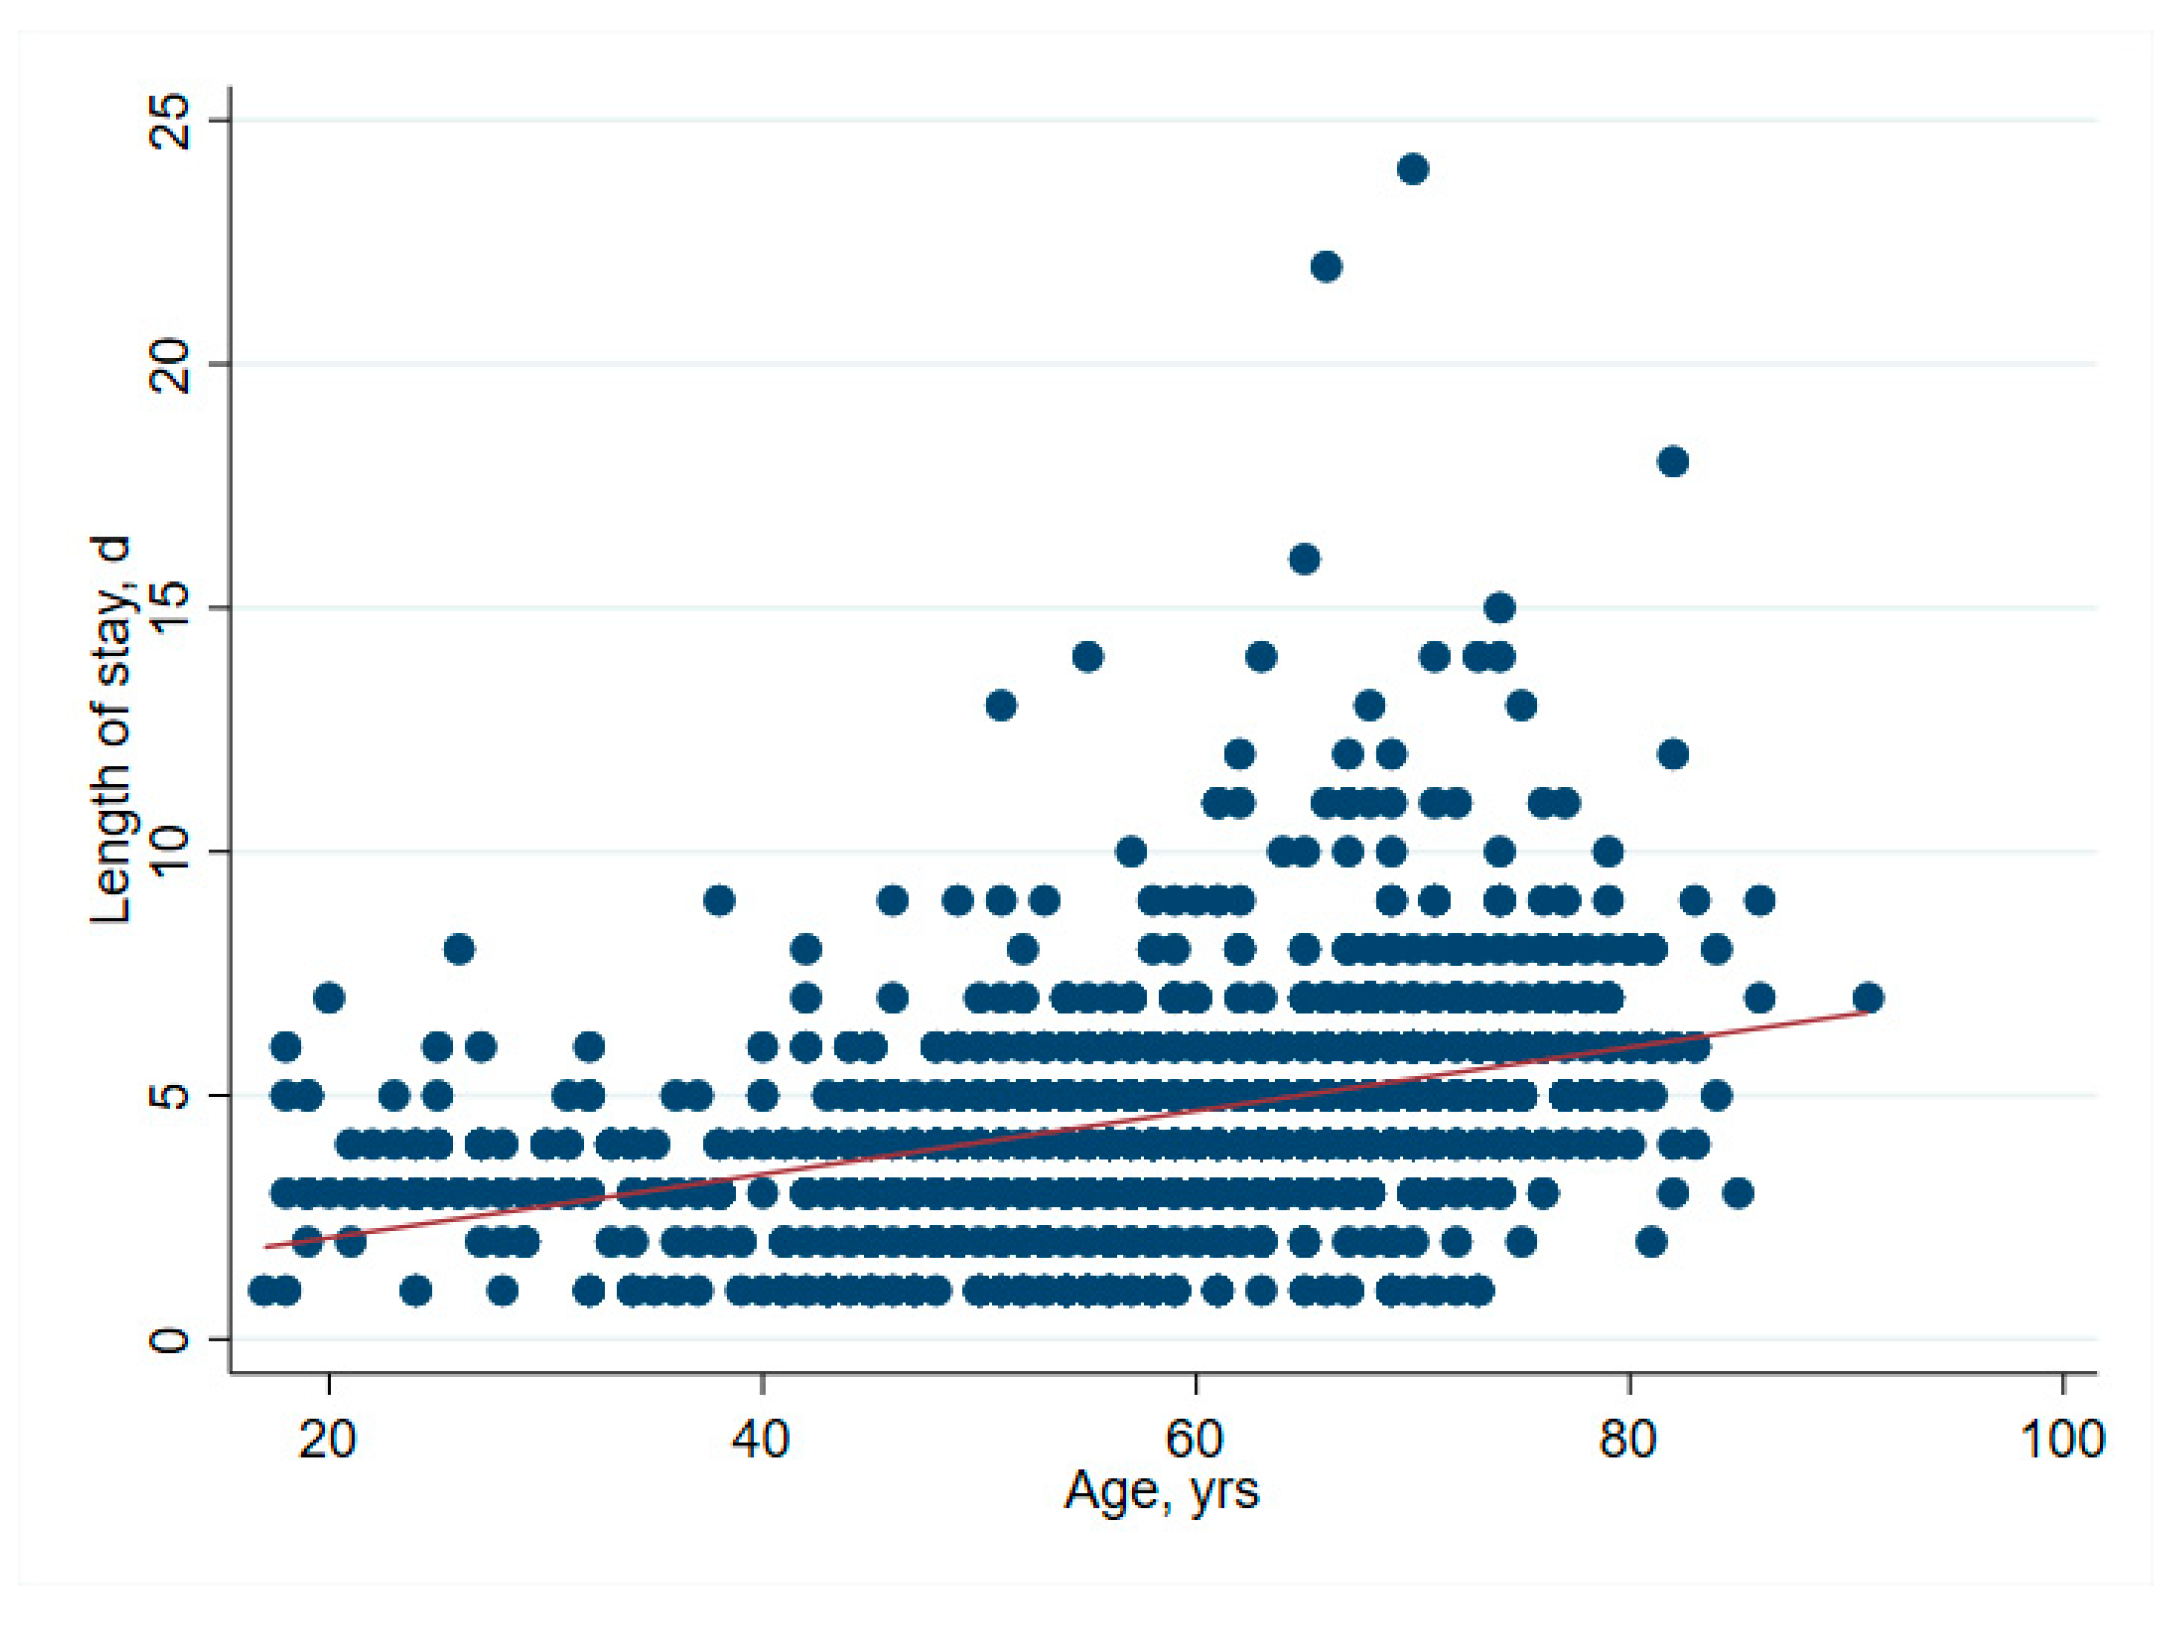
| Length of stay | 4.0 [3.0–6.0] | 4.0 [3.0–5.0] | 5.0 [4.0–7.0] | <0.001 |
| DRG projected length of stay | 7.6 [3.7–7.9] | 7.6 [6.0–7.9] | 5.7 [2.9–7.9] | <0.001 |
Publisher’s Note: MDPI stays neutral with regard to jurisdictional claims in published maps and institutional affiliations. |
© 2022 by the authors. Licensee MDPI, Basel, Switzerland. This article is an open access article distributed under the terms and conditions of the Creative Commons Attribution (CC BY) license (https://creativecommons.org/licenses/by/4.0/).
Share and Cite
Rohrer, F.; Farokhnia, A.; Nötzli, H.; Haubitz, F.; Hermann, T.; Gahl, B.; Limacher, A.; Brügger, J. Profit-Influencing Factors in Orthopedic Surgery: An Analysis of Costs and Reimbursements. Int. J. Environ. Res. Public Health 2022, 19, 4325. https://doi.org/10.3390/ijerph19074325
Rohrer F, Farokhnia A, Nötzli H, Haubitz F, Hermann T, Gahl B, Limacher A, Brügger J. Profit-Influencing Factors in Orthopedic Surgery: An Analysis of Costs and Reimbursements. International Journal of Environmental Research and Public Health. 2022; 19(7):4325. https://doi.org/10.3390/ijerph19074325
Chicago/Turabian StyleRohrer, Felix, Aresh Farokhnia, Hubert Nötzli, Frederik Haubitz, Tanja Hermann, Brigitta Gahl, Andreas Limacher, and Jan Brügger. 2022. "Profit-Influencing Factors in Orthopedic Surgery: An Analysis of Costs and Reimbursements" International Journal of Environmental Research and Public Health 19, no. 7: 4325. https://doi.org/10.3390/ijerph19074325